The Food Stamp Program and Supplemental Security Income
Social Security Bulletin, Vol. 67, No. 4, 2007
The Food Stamp Program (FSP) and Supplemental Security Income (SSI) are important parts of national public assistance policy, and there is considerable overlap in the populations that the programs serve. This article investigates FSP participation by households that include SSI recipients and assesses the importance of various provisions of the Food Stamp Program that favor SSI recipients.
The authors are with the Office of Disability and Income Assistance Policy, Office of Retirement and Disability Policy, Social Security Administration.
The findings and conclusions presented in the Bulletin are those of the authors and do not necessarily represent the views of the Social Security Administration.
Summary
The Food Stamp Program (FSP) and Supplemental Security Income (SSI) are important parts of national public assistance policy, and there is considerable overlap in the populations that the programs serve. About half of all SSI recipients reside in FSP recipient households. This article uses Social Security administrative data and the Food Stamp Quality Control samples for federal fiscal years 2001–2006 to study the prevalence of food stamp receipt among households with SSI recipients, the contribution of FSP to household income, and the importance of various FSP features in contributing to the well-being of recipient households. The prevalence of FSP participation among households that include SSI recipients is estimated to have grown steadily over the entire 2001–2006 period, rising from 47.4 percent in 2001 to 55.6 percent in 2006. This growth has occurred across all age groups of SSI recipients. The FSP contribution to household income has grown as well. In 2001, FSP increased the income of the households of SSI/FSP recipients by 13 percent; by 2006 the increase was 16.8 percent. Almost 80 percent of the food stamp recipient households that include SSI recipients receive increased benefits because of excess housing costs. In 2006, 44 percent of SSI recipients lived in households that did not receive food stamps. Given available information, it is difficult to gauge the FSP eligibility of nonparticipating households and, therefore, to assess the potential benefit of outreach efforts. Currently available measures of FSP take-up probably overstate participation among eligible households that include SSI recipients, and there is some evidence that enhanced state promotion of the FSP raises participation among households with SSI recipients. We conclude with recommendation for review and renewal of collaboration between the Food and Nutrition Service of the U.S. Department of Agriculture (the agency responsible for administering the FSP) and the Social Security Administration in ensuring that eligible SSI recipients utilize FSP benefits.
Introduction
The United States addresses poverty with multiple programs. Often the programs are intended to at least partially overlap—for example, people may receive both Temporary Assistance for Needy Families (TANF) benefits and Section 8 Housing Assistance.1 However, because programs are operated by various agencies and under different federal/state relationships, it is sometimes difficult to gain a clear picture of their combined effects on individual and family well-being. Understanding program overlap and interaction experienced "on the ground" is important to effective program management and comprehensive policy evaluation.
This article investigates interaction between Supplemental Security Income (SSI) and the Food Stamp Program (FSP). The two programs are important parts of national social assistance policy, and there is overlap in the populations they serve. In 2004 the nation spent $24.6 billion on FSP benefits and $34.7 billion on SSI benefits (Spar 2006, 236–239). While SSI recipients constitute only about 12 percent of all persons receiving food stamps, about half of all SSI recipients reside in FSP recipient households. Thus the FSP plays some role in the well-being of SSI recipients. We are interested in just what, and how large, that role is.
We begin with summaries of both programs and then analyze the prevalence of FSP participation among SSI recipients, the size of the FSP benefit and its relationship to overall household resources, and the relationship between FSP administration and SSI/FSP take-up. For data consistency we generally report program characteristics and other data for 2004, but where useful we extend the analysis to investigate changes over the 2001–2006 interval. We conclude that (1) FSP is a significant benefit for many households that include SSI recipients; (2) the FSP contribution to the well-being of SSI recipients has been increasing in recent years; (3) FSP treatment of housing costs is an important factor in the contribution of FSP benefits to the income of households with SSI recipients; and (4) there is some evidence that some SSI households not currently receiving food stamps are eligible, but the potential gain from outreach efforts is uncertain. We identify opportunities for collaboration between the U.S. Department of Agriculture's Food and Nutrition Service (FNS) and the Social Security Administration (SSA) in improving the linkage between SSI and the FSP.
Supplemental Security Income
The SSI program provides a basic national monthly income guarantee, called the federal benefit rate (FBR), to children and adults with disabilities as well as to persons aged 65 or older.
Benefits and Eligibility
In 2004 the FBR was $564 for a single individual and $846 for a couple. The FBR is adjusted annually for inflation. Because SSI is intended to be a program of last resort, payments are reduced if an individual or a couple has earnings or other income, and the amount depends as well on a person's living arrangements. In about half of the states,2 the federal SSI benefit is augmented by a state supplemental cash payment. In 33 states, SSI recipients are also immediately eligible for Medicaid (SSA 2005b, 11).
To be eligible, SSI nonelderly (younger than age 65) applicants must pass a disability test. Both elderly and nonelderly individuals must meet the same income and resource requirements. For adults, financial eligibility requires that countable income (whether from work or other sources) be less than the current FBR plus any state supplement, where available. Certain income exclusions are applied in the calculation of countable income. The SSI rules exclude the first $20 of income from all sources (the "general income exclusion"), $65 of earned income (for a total exclusion from earnings of $85 if the applicant or recipient does not have $20 of unearned income), and half of any additional earnings beyond $65. The FBR is reduced by one-third for applicants or recipients receiving food and shelter—"in-kind support and maintenance" (ISM)—in another's household and not contributing to those expenses. Generally, assets cannot exceed $2,000 for an individual and $3,000 for a couple, but one's home and automobile, as well as certain other resources, are not counted. There is a complex set of rules regarding how assets other than cash are considered.
For children, the financial eligibility requirements generally pertain to the parents whose income and resources from sources other than public assistance is partially deemed to the child. Before any income is deemed to the child recipient, certain exclusions are applied to account for needs of other family members. The disability test for children is that the child must have a medically determinable impairment (or a combination of impairments) resulting in "marked and severe functional limitations."
For persons aged 65 or older, only the financial test for SSI eligibility applies. The disability test for nonelderly adults is the same test used for Social Security Disability Insurance (DI) and is quite stringent. It requires that the applicant be either blind or have a physical or mental impairment that prevents him or her from engaging in any substantial gainful activity (SGA) and that has lasted or is expected to last for a continuous period of at least 12 months or to result in death. Substantial gainful activity is generally defined in terms of specific earnings thresholds. In 2004 the SGA standard was $810 or more per month, so applicants judged capable of earning this much anywhere in the economy were ineligible for SSI. The threshold of SGA is automatically adjusted each year for changes in the average wage.
Once eligibility is established, the monthly SSI payment is simply the FBR (plus the applicable state supplement), less any countable income.
State Supplements
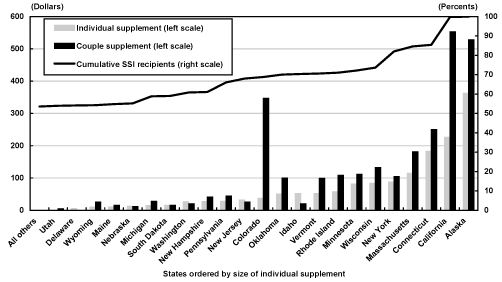
All but six states supplement the federal benefit rate, and in some cases the supplement is substantial (SSA 2005a). For 22 states, these supplements only address special needs and are not paid to all recipients. However, 23 states provide a cash supplement to the FBR that is paid to all single or couple recipients or (in most cases) both. Chart 1 provides information on the size of supplements provided universally to nonelderly adult SSI recipients living independently, which is generally matched for elderly cases. The chart presents states ordered by size of the supplement paid to individuals living alone and, moving from lowest to highest, shows the cumulative share of SSI recipients accounted for. Twenty-eight states provide no universal supplement for nonelderly adult SSI recipients. These states accounted for 53 percent of all SSI recipients in this age group. Beyond this, several states provide supplements that are well under $50 per month. The "median supplement recipient"—ranked by state supplement—resides in Oklahoma. California's supplement is exaggerated by inclusion of a payment in lieu of food stamps.
Monthly state SSI supplements to the federal benefit rate for nonelderly adult individuals and couples living independently, 2004
| States ordered by size of individual supplement |
Cumulative SSI recipients (in percent) |
Individual supplement (in dollars) |
Couple supplement (in dollars) |
|---|---|---|---|
| All others | 53.60 | 0.00 | 0.00 |
| Utah | 53.95 | 0.00 | 4.60 |
| Delaware | 54.15 | 5.00 | 0.00 |
| Wyoming | 54.25 | 9.90 | 25.12 |
| Maine | 54.82 | 10.00 | 15.00 |
| Nebraska | 55.19 | 12.00 | 11.00 |
| Michigan | 58.85 | 14.00 | 28.00 |
| South Dakota | 59.04 | 15.00 | 15.00 |
| Washington | 60.84 | 25.90 | 19.90 |
| New Hampshire | 61.07 | 27.00 | 41.00 |
| Pennsylvania | 66.03 | 27.40 | 43.70 |
| New Jersey | 68.00 | 31.25 | 25.36 |
| Colorado | 68.85 | 37.00 | 347.00 |
| Oklahoma | 70.05 | 50.00 | 100.00 |
| Idaho | 70.40 | 52.00 | 20.00 |
| Vermont | 70.63 | 52.04 | 98.88 |
| Rhode Island | 71.08 | 57.35 | 108.50 |
| Minnesota | 72.20 | 81.00 | 111.00 |
| Wisconsin | 73.65 | 83.78 | 132.05 |
| New York | 82.03 | 87.00 | 104.00 |
| Massachusetts | 84.63 | 114.39 | 180.60 |
| Connecticut | 85.45 | 183.00 | 250.00 |
| California | 99.83 | 226.00 | 553.00 |
| Alaska | 100.00 | 362.00 | 528.00 |
A Sample Case. To illustrate the process of SSI eligibility determination for a nonelderly adult, consider for example a nonelderly woman, living alone, who comes to the local Social Security field office to apply for SSI in 2004. She receives preliminary application materials that require assembling detailed information on her disability and recent medical and work histories, as well as income and assets. Following an interview covering the nature of her disability and the nondisability factors of entitlement, the disability related documentation of her case is passed to the respective state's Disability Determination Services for disability assessment, while the financial requirements are assessed by the Social Security Administration.
An applicant determined to be eligible is said to be "awarded" benefits. With no other income, the woman in this example receives the 2004 FBR, $564.
The first $20 of income from sources other than earnings is ignored in SSI payment calculation. Beyond this general income exclusion amount, such "unearned" income is counted dollar-for-dollar against SSI. Payments from the Old-Age, Survivors, and Disability Insurance (OASDI) programs are treated as unearned income, so a disabled person using SSI to supplement a meager Social Security Disability Insurance or Old-Age and Survivors benefit could at most gain a combined benefit only $20 greater than the FBR.
Earnings are treated differently. Suppose that the woman previously profiled is determined SSI eligible and begins receiving the FBR monthly. Suppose also that she takes a job, working 15 hours per week at $5.15 per hour for a monthly income of $334.75. Her benefit is reduced by her countable income. Deductions include the general income exclusion of $20 (if not already applied to unearned income), an earned income exclusion of $65, and half of what remains after the fixed deductions are applied, for total deductions of $209.87. Countable income is therefore $334.75 – $209.87 = $124.88. Therefore this woman would receive $564 (again, the 2004 FBR) – $124.88 = $439 (benefits are rounded down to the nearest dollar), and have a total income of $773.75. Note that because of the general and earned income exclusions, the benefit has been reduced by only $124.88, so the average benefit reduction rate is ($124.88 / $334.75) x 100 = $.373 per dollar of earnings. Each additional dollar of earnings reduces the SSI payment by $.50, the marginal benefit reduction rate. Because $334.75 is well below the SGA threshold of $810, earning this amount does not threaten payment or eligibility unless upon eligibility redetermination this part-time work signals to the state Disability Determination Service a capacity to earn more.
In practice the rules surrounding work are more complex and generally more permissive than this mechanical example suggests, but only about 5 percent of SSI recipients report earnings (SSA 2005b, 74). In states that supplement the FBR, the benefit calculation is generally conducted in the same way, but it is the FBR plus the state supplement that is used as the point of reference in determining eligibility and payment amounts.
The Food Stamp Program
The FSP helps people buy food by providing grocery credit. The name is an anachronism; today all recipient households receive the FSP benefit through the use of electronic benefit transfer (EBT) cards. These are ATM-like debit cards that recipients use to purchase food from authorized grocery stores and supermarkets. The benefit is adjusted annually for changes in food costs. The FSP eligibility unit is the household, defined as an individual or group of people who live, buy food, and prepare meals together. This contrasts with SSI, which is determined on an individual, and not household, basis.
Establishing Eligibility
Households with elderly or disabled members, including all households that have an SSI recipient, are advantaged in evaluation of FSP eligibility. To be eligible for the FSP benefit, households without elderly or disabled members must have gross (before tax) monthly incomes less than 130 percent of federal poverty guidelines for the previous year (in 2004 this was $973 per month for a single individual and $1,313 for two persons). After certain allowed deductions for living, working, dependent care, child support, and excess shelter costs, countable income cannot exceed 100 percent of the poverty standard. Households must not have more than $2,000 in countable assets such as cash, savings deposits, stocks and bonds, and certain nonessential vehicles. Certain adults are required to register for work, and some adults without dependents are required to work or to participate in training as a condition of assistance.
Persons receiving SSI are in most circumstances automatically eligible for the FSP if they live alone—they are "categorically" eligible. Categorical eligibility also applies to multiple person households in which all members receive SSI, TANF, or General Assistance income. When SSI recipients live with others who are not public assistance recipients, FSP eligibility is assessed on the basis of total household income and composition, and the resources of the household may make the entire group, including SSI recipients, ineligible. Such households are exempted from the FSP gross income eligibility test, and the countable assets standard is $3,000, not $2,000. (The net income test continues to apply.) A more generous allowance is made for excess housing costs. Out-of-pocket medical expenses in excess of $35 per month incurred by elderly or disabled household members are also deducted in calculating countable household income. In California the food stamp benefit is "cashed out" in the state's SSI supplement. Consequently, SSI recipients in California living independently are ineligible for the FSP, and benefits for other households that include SSI recipients are calculated without including the SSI recipient in the budget unit or counting the SSI recipient's income in assessing household resources (Arnold and Marinacci 2003).
The Food Stamp Program Benefit
Once eligibility is established, participating households are expected to be able to devote 30 percent of their counted monthly cash income (after adjustment for the deductions already cited) to food purchases. The FSP benefit then makes up the difference between 30 percent of countable income and a maximum benefit level that is derived from a model budget developed by the U.S. Department of Agriculture, called the Thrifty Food Plan (TFP). Because both the TFP and the allowable standard (living expense) deduction vary by household size, benefits vary as well. The maximum benefit schedule is detailed in Table 1. Few households receive the maximum benefit, because most have countable income.
| Household size |
Maximum allotment a |
Maximum gross income b |
Maximum net (countable) income |
|---|---|---|---|
| 1 | 141 | 973 | 749 |
| 2 | 259 | 1,313 | 1,010 |
| 3 | 371 | 1,654 | 1,272 |
| 4 | 471 | 1,994 | 1,534 |
| 5 | 560 | 2,334 | 1,795 |
| 6 | 672 | 2,647 | 2,057 |
| 7 | 743 | 3,014 | 2,319 |
| 8 | 849 | 3,354 | 2,580 |
| Per each additional person | 106 | 341 | 262 |
| SOURCE: U.S. Department of Agriculture, Food and Nutrition Service. | |||
| a. Values differ for Alaska, Hawaii, Guam, and the U.S. Virgin Islands. | |||
| b. Gross income is the household's total nonexcluded income before any deductions. Net or countable income is gross income less allowable deductions. | |||
Calculation of the FSP benefit is highly dependent on the nature and amount of deductions for the household unit. Consequently, benefit calculation is best illustrated by example. We begin with a simple illustration of eligibility and benefit determination pertinent to SSI recipients and then highlight variants.
Single and Couple Example with Standard Deduction Only. Consider first the single SSI recipient living alone and wholly dependent on SSI in a state without a state supplement. In 2004, the FBR for this individual was $564. The FSP standard deduction was $134 for households of four or fewer people, so countable income was $430. Thirty percent of $430 is $129. The maximum FSP allotment for a 1 person household was $141 (see Table 1), therefore the person was eligible for $141 – $129 = $12 in food stamps. The corresponding calculation for an SSI couple, again without income other than the ($846) SSI payment and only the standard deduction, indicates an FSP benefit of $45.
The FSP benefit in this standard deduction example is not large: Calculated as a change in total resources for spending, what we call the food stamp increment is 2.1 percent for the single individual and 5.4 percent for a couple. These figures apply to states without a supplement. If we consider Oklahoma, the state with the median supplement (see Chart 1), the FSP benefit for the single person falls to $10 (all categorically eligible households receive at least this amount); the couple's benefit is now $32.
Single and Couple Example with Additional FSP Deductions. These examples involve only the standard deduction; most recipient households are allowed more. Working recipients deduct 20 percent of earnings for work expenses. SSI recipients living alone are additionally allowed to deduct from income out-of-pocket medical expenses in excess of $35 per month and "excess shelter costs," defined as the amount by which rent or mortgage payments plus utility costs exceed half of income after all other deductions. For an SSI couple or individual with low housing costs, in principle each dollar of out-of-pocket medical costs beyond $35 leads to $.30 more in food stamps. For an SSI individual or couple, every $1 in rent paid beyond half of countable income before adjustment for excess housing costs produces $.30 more in food stamps. The excess medical and housing costs deductions interact: Each $1 of excess medical costs for households with excess housing costs produces an increase of $.45 in FSP benefits. Obviously, the medical expenses and excess housing cost deductions potentially have a substantial effect on the food stamp increment. The practical importance of the deductions depends on how many recipients have them, a matter to be investigated later in this article.
Households Shared with Others. The examples developed above involved a single individual living alone or a married couple, both of whom are SSI recipients, also living alone. If this individual or couple were to be living with others not receiving SSI, a number of things would change. The standard deduction would increase if the household included more than four persons. The combined income of household members would be used to calculate countable income and compute benefits. The excess housing cost deduction is restricted—"capped"—for households without a disabled or elderly person (in 2004 the cap was $378,3 but all households with SSI recipients receive the deduction without restriction. The excess out-of-pocket medical expenses deduction applies only to the SSI recipient's expenses.
When Income Changes
While emphasizing nutrition, the FSP provides real income support, offsetting income decline with increased benefits and reducing these benefits when income rises. For most families, especially those with income based on wages, income changes from month to month. In principle this should mean monthly variation in the FSP benefit as well. In practice, requiring adjustment for small changes in income is administratively inefficient. Instead FSP regulations require reporting only changes in gross monthly income from earnings in excess of $100 and from other sources in excess of $50. Adjustments to changes less than those amounts occur periodically when eligibility is reassessed. Some states operate "Combined Application Projects" or CAPs (FNS 2005). Under the CAP demonstrations, SSI recipients living alone without other income can file a shortened Food Stamp application without having a face-to-face interview at the FSP office. Benefit amounts are either standardized or calculated automatically based on a standard shelter and medical expense deduction. An application constructed from the SSA interview is transferred to the FSP office electronically. As of mid-2007, 11 states were operating CAPs in some locations.4 CAP cases are expected to experience little month-to-month income change, reducing the need for frequent review and redetermination.
Managing the Food Stamp Program
Although the federal government pays most FSP costs and sets most of the regulations, the program is operated by states, generally through local welfare offices.
Payment accuracy is evaluated annually by a joint federal/state review of a sample of cases drawn from each state's recipient list. This "quality control" (QC) sample is sufficiently large to provide reliable information on the people receiving food stamps, the rate at which administrators make errors in benefit determination, and the amounts of payments involved. States can be charged for the benefit cost of error rates in excess of national averages. In practice such penalties are often waived; when enforced, states pay by investing the fine (penalty) in programs to improve performance. The QC system creates incentive for promoting accurate collection of data on income, including SSI receipt. States can and do check on SSI status by using the Social Security Administration's State Data Exchange program to investigate benefit status for all members of applicant households.
Important Questions
The Food Stamp Program overview sets the stage for more detailed study of FSP receipt among SSI recipients. Important questions include:
- What is the prevalence of FSP participation among SSI recipients?
- What is the contribution of the FSP to the income of households in which SSI recipients reside?
- How important are the housing and medical cost deductions in determination of benefits for the households of SSI recipients?
- Could outreach efforts increase FSP participation among households of SSI recipients?
Data Overview
We use two data sources for this analysis. The first is unpublished tabulations of administrative data on SSI receipt from administrative files provided by the Social Security Administration. The second is the Food Stamp Program Quality Control (FSPQC) Database for federal fiscal years FYs 2001–2006. The FSPQC Database is produced by Mathematica Policy Research, Inc., under contract to the Food and Nutrition Service of the U.S. Department of Agriculture (Poikolainen and Ewell 2005). The FSPQC Database for each year contains a rich set of demographic, economic, and FSP eligibility and benefit information on a nationally representative probability sample of approximately 49,000 recipient households. "Nationally representative" here means representative of the FSP caseload in an average month during the year. The sample is collected throughout the 12 months and therefore differs from a simple single month cross section. Our analysis excludes California because of the cash-out. Over the 2001–2006 interval, California accounted for 16.8 percent of all SSI recipients.
The Prevalence of Food Stamp Receipt
Table 2 illustrates the use of both resources, SSI and the FSP. The data for each year are separately tabulated by SSI recipient age group. The SSI recipient counts in the first row for each group are from Social Security administrative records and are averages for the months of the fiscal year. These are exact counts of payments made. The counts in the second row are derived from FSPQC sampling probabilities. "Prevalence" is just the ratio of the estimated total number of SSI recipients living in units receiving food stamps (from the FSPQC) divided by the total number of recipients in the relevant age class (also from Social Security administrative data). Thus we estimate (see the age group at the bottom of the table) that 939,106 elderly SSI recipients lived in FSP recipient households in 2006; this was 63.6 percent of all SSI recipients in the group. Although the denominators for these statistics are from administrative data and are effectively known with certainty, the FSP recipient counts are sample based and therefore subject to sampling errors. However, since the samples are quite large, confidence intervals around the sample-based recipient estimates are small, so the precision of the prevalence estimates is high.
| SSI recipient characteristic | 2001 | 2002 | 2003 | 2004 | 2005 | 2006 |
|---|---|---|---|---|---|---|
| All | 5,566,070 | 5,616,037 | 5,689,695 | 5,780,685 | 5,865,265 | 5,954,299 |
| Estimated SSI/FSP beneficiaries | 2,638,113 | 2,692,525 | 2,784,340 | 2,976,889 | 3,142,254 | 3,308,251 |
| Prevalence of receipt (percents) | 47.4 (0.63) |
47.9 (0.64) |
48.9 (0.67) |
51.5 (0.74) |
53.6 (1.02) |
55.6 (0.88) |
| Under age 18 | ||||||
| SSI recipients | 778,437 | 802,661 | 834,929 | 876,994 | 919,647 | 956,814 |
| Estimated SSI/FSP beneficiaries | 239,804 | 266,452 | 301,471 | 346,522 | 367,951 | 368,303 |
| Prevalence of receipt (percents) | 30.8 (1.26) |
33.2 (1.25) |
36.1 (1.31) |
39.5 (1.50) |
40.0 (1.67) |
38.5 (1.76) |
| Aged 18 to 64 | ||||||
| SSI recipients | 3,253,574 | 3,300,656 | 3,354,074 | 3,415,654 | 3,470,322 | 3,521,144 |
| Estimated SSI/FSP beneficiaries | 1,603,342 | 1,659,351 | 1,671,763 | 1,791,523 | 1,910,882 | 2,000,843 |
| Prevalence of receipt (percents) | 49.3 (0.79) |
50.3 (0.82) |
49.8 (0.83) |
52.5 (0.92) |
55.1 (1.22) |
56.8 (1.09) |
| Over age 64 | ||||||
| SSI recipients | 1,534,059 | 1,512,721 | 1,500,691 | 1,488,036 | 1,475,297 | 1,476,342 |
| Estimated SSI/FSP beneficiaries | 794,966 | 766,722 | 811,106 | 838,844 | 863,421 | 939,106 |
| Prevalence of receipt (percents) | 51.8 (1.38) |
50.7 (1.42) |
54.0 (1.57) |
56.4 (1.74) |
58.5 (2.67) |
63.6 (2.08) |
| SOURCE: Authors' calculations using data from the Social Security Administration, Office of Research, Evaluation, and Statistics, Division of SSI Statistics and Analysis and the Food Stamp Program Quality Control Database. | ||||||
| NOTES: SSI = Supplemental Security Income; FSP = Food Stamp Program. | ||||||
| Ninety-five percent confidence intervals (plus/minus) in parentheses are shown in percentage points. | ||||||
Table 2 supports a number of inferences. One is that utilization of food stamps is not universal among households that include SSI recipients. However, these data do not reveal the extent to which nonparticipation reflects household ineligibility or failure to take advantage of a benefit to which the household is entitled. A second inference is that in general, child SSI recipients are less likely to live in FSP households than are adults, and elderly SSI recipients are more likely to receive food stamps than others. Perhaps the most significant discovery is that the prevalence of food stamp receipt grew substantially over the 2001–2006 interval, with the largest increases occurring in the last 2 years. The differences between 2001 and 2006 are statistically significant (α = .05) for all subgroups.
State Supplements and Food Stamp Receipt
Because the FSP benefit is nationally uniform (with the exception of Hawaii and Alaska), it would be reasonable to expect that the prevalence of food stamp receipt would be lower in states with a substantial SSI supplement than in states without. However, separate calculation of FSP prevalence in states grouped by size of supplement revealed no clear pattern. For the elderly, living in a high supplement state is associated with higher, not lower, prevalence of food stamp receipt. For children, the opposite is true. It may be that the effect of high benefits is offset by high living costs. On average, housing costs—the key component of interstate variation in costs of living—are positively correlated with the presence and amount of the SSI state supplement.5
The Food Stamp Program and Income
Next, we turn to the contribution of FSP benefits to household income. For this purpose we continue separate analysis by age and further differentiate between recipients living alone or with spouses only and SSI recipients living with others. Table 3 provides a sense of the reliability of estimates for various subgroups by reporting sample sizes and the estimated number of SSI recipients (the sum of sample weights) for various subgroups in 2004. Some of the subgroups are so small (singles under age 18 living alone, married recipients under age 18 living with spouse, and married persons over age 64 living with others) that the results are meaningless. However for subgroup samples that are large, results can be viewed with considerable confidence.
| SSI recipient characteristic | Population estimate |
Sample size |
Average monthly household receipt | The Food Stamp increment (percents) | |||||||||
|---|---|---|---|---|---|---|---|---|---|---|---|---|---|
| Aggregate: Mean food stamp benefit as increment to mean household cash income |
Across households: Ratio of food stamp benefit to total household cash income |
||||||||||||
| SSI payment (dollars) |
Food stamp benefit |
OASDI | Earned income | All other income |
|||||||||
| Average amount (dollars) |
Percent with earned income |
||||||||||||
| Average benefit (dollars) |
Percent receiving benefit |
Mean | Standard error of mean |
Median | |||||||||
| Total sample | |||||||||||||
| Over age 64 | 838,844 | 3,487 | 383.83 | 83.10 | 254.31 | 57.5 | 8.58 | 1.7 | 22.68 | 12.4 | 12.8 | 0.2 | 10.5 |
| Aged 18 to 64 | 1,791,523 | 9,013 | 479.31 | 116.65 | 154.94 | 34.3 | 32.20 | 6.6 | 68.62 | 15.9 | 17.4 | 0.3 | 13.8 |
| Under age 18 | 346,522 | 1,650 | 711.85 | 245.85 | 77.85 | 14.3 | 177.06 | 23.0 | 188.9 | 21.3 | 28.8 | 0.7 | 20.6 |
| Total | 2,976,889 | 14,150 | 479.47 | 122.23 | 173.97 | 38.5 | 42.40 | 7.1 | 69.67 | 16.0 | 17.4 | 0.2 | 13.4 |
| Living alone or with spouse | |||||||||||||
| Single | |||||||||||||
| Over age 64 | 610,728 | 2,544 | 357.51 | 68.40 | 250.53 | 60.7 | 1.01 | 0.6 | 13.13 | 11.0 | 11.8 | 0.2 | 9.9 |
| Aged 18 to 64 | 1,046,809 | 5,353 | 424.01 | 72.13 | 143.86 | 33.5 | 8.38 | 4.0 | 11.38 | 12.3 | 13.0 | 0.2 | 12.0 |
| Under age 18 | a | 32 | a | a | a | a | a | a | a | a | a | a | a |
| Total | 1,661,346 | 7,929 | 388.45 | 70.69 | 183.10 | 43.5 | 5.67 | 2.7 | 12.03 | 12.0 | 12.5 | 0.1 | 11.3 |
| Married | |||||||||||||
| Over age 64 | 169,722 | 674 | 557.10 | 109.89 | 257.16 | 45.0 | 17.26 | 3.1 | 22.22 | 12.9 | 13.6 | 0.4 | 11.1 |
| Aged 18 to 64 | 137,738 | 663 | 515.98 | 116.27 | 258.64 | 46.3 | 24.68 | 6.4 | 21.60 | 14.2 | 16.7 | 0.6 | 12.0 |
| Under age 18 | a | 1 | a | a | a | a | a | a | a | a | a | a | a |
| Total | 307,524 | 1,338 | 538.68 | 112.75 | 257.77 | 45.6 | 20.58 | 4.6 | 21.93 | 13.4 | 15.0 | 0.4 | 11.3 |
| Living with others | |||||||||||||
| Single | |||||||||||||
| Over age 64 | 43,639 | 209 | 410.50 | 159.78 | 303.67 | 65.7 | 73.32 | 9.6 | 103.82 | 17.9 | 21.0 | 1.3 | 16.8 |
| Aged 18 to 64 | 489,552 | 2,410 | 559.81 | 181.56 | 137.04 | 30.9 | 46.07 | 8.4 | 181.22 | 19.6 | 23.5 | 0.5 | 19.8 |
| Under age 18 | 342,649 | 1,617 | 715.49 | 248.14 | 77.04 | 14.1 | 178.99 | 23.2 | 190.85 | 21.3 | 29.1 | 0.7 | 21.0 |
| Total | 875,840 | 4,236 | 613.28 | 206.52 | 121.86 | 26.0 | 99.43 | 14.3 | 181.13 | 20.3 | 25.6 | 0.4 | 19.9 |
| Married | |||||||||||||
| Over age 64 | 14,755 | 60 | 642.79 | 156.56 | 232.07 | 43.6 | 30.56 | 6.0 | 183.33 | 14.4 | 18.4 | 2.3 | 10.8 |
| Aged 18 to 64 | 117,424 | 587 | 593.70 | 243.35 | 206.65 | 40.6 | 195.45 | 23.1 | 164.60 | 21.0 | 31.8 | 4.2 | 19.3 |
| Under age 18 | a | a | a | a | a | a | a | a | a | a | a | a | a |
| Total | 132,179 | 647 | 599.18 | 233.66 | 209.49 | 41.0 | 177.04 | 21.2 | 166.69 | 20.3 | 30.2 | 3.8 | 18.6 |
| SOURCE: Authors' calculations using the Food Stamp Program Qualify Control Database. | |||||||||||||
| NOTES: SSI = Supplemental Security Income; OASDI = Old-Age, Survivors, and Disability Insurance. | |||||||||||||
| a. Too few observations for meaningful calculations. | |||||||||||||
For each subgroup we report average income and benefit sources plus, on the right-hand side, three measures of the increment to resources provided by the FSP. The first increment measure (Aggregate: Mean food stamp benefit as increment to mean cash income) is simply the average food stamp benefit for the households of SSI recipients in the housing/marital status class, expressed as a percentage of average monthly household income from all other sources. This provides a sense of the size of the aggregate resources provided by the FSP for the respective classes of SSI/FSP recipient households. The second increment measure (Across households: Ratio of food stamp benefit to total household income—mean) is the average across SSI recipients of the ratio of the household's food stamp benefit to household cash income. This measure is an "average of ratios," as opposed to the first measure, which is a "ratio of averages." The second measure corresponds to the increment calculation introduced in the earlier discussion of the standard FSP income deduction. We include estimated standard errors for this mean. Within each housing/marital status class, the distribution of the food stamp increment is typically skewed to the right; so the median of the distribution, the third measure of the food stamp increment and the last column in the table, falls below the mean in every age/housing situation class.
Consider single working-age SSI adult recipients who live alone. We estimate that in 2004 there were slightly more than 1 million (1,046,809) people in this group. About one-third (33.5 percent) of all such recipients received OASDI benefits in addition to SSI payments. Very few—4 percent—had earned income. The FSP increased current income in aggregate for this group by 12.3 percent and on average across these households by 13 percent. The median of the increment distribution is 12 percent. Thus in contrast to the very modest (2.1 percent) food stamp increment calculated earlier for a single individual without excess housing or medical cost deductions, the FSPQC data reveal an average increment of 13 percent. For couples, the increment is not 5.4 percent, as in our earlier without-deductions example, but 16.7 percent. The largest increment is found for SSI recipients living in households with others. Cases like this include child SSI recipients living with single mothers, single mother recipients living with children who are supported by TANF, and elderly adults living with a child. For SSI recipients living in households with others, the average increment is over 20 percent. By all measures, we find that the FSP benefit is important.
Table 4 presents the results of repeating the first of the increment measures, the ratio of mean food stamp benefit to mean SSI recipient household income, across all six years of our data. We have excluded results for the three subgroups with very small sample sizes. For the other subgroups the results are clear: The FSP contribution to the resources of recipient households that include SSI recipients grew over the 2001–2006 interval. Overall from 2001 through 2002, the food stamp increment is estimated to have been 13.3 percent; from 2005 through 2006, the corresponding estimate is 16.8 percent. Thus, over the 2001–2006 period under study, the likelihood that SSI recipients live in FSP recipient households has grown (recall Table 2), and, among those recipient households, the contribution made by the FSP has increased.
| SSI recipient characteristic |
2001 | 2002 | 2003 | 2004 | 2005 | |||||
|---|---|---|---|---|---|---|---|---|---|---|
| Mean (percent) |
Standard error |
Mean (percent) |
Standard error |
Mean (percent) |
Standard error |
Mean (percent) |
Standard error |
Mean (percent) |
Standard error |
|
| Total sample | ||||||||||
| Over age 64 | 9.7 | 0.3 | 10.2 | 0.2 | 10.1 | 0.3 | 12.8 | 0.2 | 13.1 | 0.3 |
| Aged 18 to 64 | 21.3 | 2.8 | 17.3 | 1.3 | 16.3 | 0.5 | 17.4 | 0.4 | 18.6 | 0.4 |
| Under age 18 | 46.0 | 13.7 | 25.3 | 0.9 | 27.7 | 0.9 | 28.9 | 0.8 | 30.1 | 0.8 |
| Total | 20.0 | 2.1 | 16.1 | 0.8 | 15.7 | 0.3 | 17.4 | 0.2 | 18.4 | 0.3 |
| Living alone or with spouse | ||||||||||
| Single | ||||||||||
| Over age 64 | 7.9 | 0.2 | 8.8 | 0.2 | 9.5 | 0.4 | 11.8 | 0.2 | 12.1 | 0.3 |
| Aged 18 to 64 | 10.8 | 0.8 | 11.0 | 0.7 | 12.0 | 0.7 | 13.0 | 0.2 | 13.9 | 0.3 |
| Under age 18 | a | a | a | a | a | a | a | a | a | a |
| Total | 9.6 | 0.5 | 10.2 | 0.5 | 11.1 | 0.5 | 12.5 | 0.1 | 13.3 | 0.2 |
| Married | ||||||||||
| Over age 64 | 9.8 | 0.6 | 10.7 | 0.6 | 9.6 | 0.4 | 13.6 | 0.5 | 14.0 | 0.6 |
| Aged 18 to 64 | 12.2 | 0.6 | 13.9 | 1.1 | 14.4 | 0.7 | 16.7 | 0.8 | 17.1 | 0.7 |
| Under age 18 | a | a | a | a | a | a | a | a | a | a |
| Total | 10.9 | 0.4 | 12.1 | 0.6 | 11.4 | 0.4 | 15.0 | 0.5 | 15.2 | 0.5 |
| Living with others | ||||||||||
| Single | ||||||||||
| Over age 64 | 16.2 | 1.4 | 14.2 | 0.7 | 18.3 | 1.7 | 21.0 | 1.7 | 22.7 | 2.0 |
| Aged 18 to 64 | 28.3 | 4.9 | 24.6 | 3.6 | 22.9 | 0.5 | 23.5 | 0.5 | 27.0 | 1.2 |
| Under age 18 | 46.1 | 13.7 | 25.7 | 0.9 | 27.9 | 0.9 | 29.1 | 0.8 | 30.2 | 0.9 |
| Total | 31.1 | 4.6 | 23.7 | 2.2 | 24.5 | 0.5 | 25.6 | 0.4 | 28.1 | 0.7 |
| Married | ||||||||||
| Over age 64 | a | a | a | a | a | a | a | a | a | a |
| Aged 18 to 64 | 62.8 | 26.6 | 28.0 | 1.3 | 26.8 | 1.2 | 31.8 | 4.4 | 30.6 | 1.3 |
| Under age 18 | a | a | a | a | a | a | a | a | a | a |
| Total | 55.6 | 22.7 | 26.5 | 1.2 | 26.4 | 1.1 | 30.3 | 3.9 | 30.2 | 1.2 |
| SOURCE: Authors' calculations using the Food Stamp Program Quality Control Database, 2001–2006. | ||||||||||
| NOTE: SSI = Supplemental Security Income. | ||||||||||
| a. Too few observations for meaningful calculations. | ||||||||||
The results in Table 4 cover all SSI recipients living in FSP recipient households. As Table 3 indicates, many of these households have income from other sources. Suppose we consider instead just the subset of individuals and couples living alone that depends wholly on SSI or a combination of SSI and OASDI benefits for cash income and receives nothing from other sources, as reported in the FSPQC Database. In 2004, 66 percent of all SSI/FSP recipients belonged to this subset. Given the amount of the FBR and procedures for SSI payment calculation (each dollar of OASDI income beyond the first $20 reduces the SSI payment by a dollar), these people have incomes below the official poverty standard as applied by the U.S. Census Bureau (DeNavas-Walt, Proctor, and Lee 2005) and thus are of particular concern. How significant is the FSP benefit for this officially poor and "wholly dependent" group?
Table 5 presents the average increment to household income created by the FSP for adults in wholly dependent households, by age and marital status. The table also reports the percentage of all persons in each age/housing situation class (that is, whether single or married, living alone or with others) accounted for by the wholly dependent group. The results for the two subgroups of wholly dependent singles living alone (those aged 18–64 and 65 or older) do not differ much from what is reported in Table 4 because over 87 percent of single SSI recipients are wholly dependent. For the wholly dependent married subgroups, the food stamp increment is larger than the average for those not wholly dependent. Overall, 66 percent of all SSI recipients living in FSP households were singles or couples completely reliant on FSP benefits.
Singles or couples wholly dependent on OASDI and/or SSI are not the only SSI/FSP recipients relying on public assistance. SSI recipients living in food stamp recipient households that have income from only OASDI and/or SSI and TANF (Wamhoff and Wiseman 2007) are in a similar situation. There are 1,614 SSI recipients in the 2004 FSPQC sample who live in a household that receives TANF and nothing else, except in some instances OASDI. This group represents an estimated 332,345 recipients nationwide. One-quarter of these recipients are children. On average for this group of TANF/SSI families, the FSP increases effective income by 20.7 percent (σ = .45), even more than was true for wholly dependent non-TANF cases.
| SSI recipient characteristic | Food stamp increment to total household income (standard error) |
Population estimate |
Estimate of total wholly dependent |
Share of all persons estimated to be wholly dependent |
|---|---|---|---|---|
| Aged 18 to 64 | ||||
| Single living alone | 13.4 (.20) |
1,046,809 | 913,428 | 87.3 |
| Married living alone with spouse | 20.1 (1.2) |
137,738 | 84,164 | 61.1 |
| Over age 64 | ||||
| Single living alone | 12.2 (.25) |
610,728 | 534,943 | 87.6 |
| Married living alone with spouse | 15.8 (.71) |
169,722 | 100,989 | 59.5 |
| SOURCE: Authors' calculations using the Food Stamp Program Quality Control Database. | ||||
| NOTES: SSI = Supplemental Security Income; OASDI = Old-Age, Survivors, and Disability Insurance. | ||||
The Deductions that Count
The difference between the value of the FSP benefit calculated on the basis of the FBR and standard deduction alone and the much more substantial actual contribution uncovered in the FSPQC data is attributable to allowed deductions. For SSI recipients, two deductions are likely to be important: excess medical and housing costs. Table 6 reports the prevalence of each type of deduction among FSP recipient households that include SSI recipients. Prevalence is the estimated proportion of SSI/FSP recipients in the living arrangement class for which deduction occurs in some amount. The tabulations in Table 6 are divided by recipient age and living arrangements. (This tabulation covers all FSP households with SSI recipients, not only the wholly dependent group considered in Table 5.)
| SSI recipient characteristic | Total | Medical cost | Excess shelter | ||
|---|---|---|---|---|---|
| Receiving deduction |
Prevalence (percents) |
Receiving deduction |
Prevalence (percents) |
||
| All under age 18 | 346,522 | 7,557 | 2.2 | 215,420 | 62.2 |
| Aged 18 to 64 | |||||
| Single living alone | 1,046,809 | 44,517 | 4.3 | 790,882 | 75.6 |
| Married living alone with spouse | 137,738 | 10,728 | 7.8 | 110,317 | 80.1 |
| All others | 606,976 | 17,824 | 2.9 | 412,363 | 67.9 |
| Over age 64 | 838,844 | 29,650 | 3.5 | 543,760 | 64.8 |
| SOURCE: Authors' calculations using the Food Stamp Program Quality Control Database, 2004. | |||||
| NOTE: SSI = Supplemental Security Income. | |||||
The excess housing cost deduction is much more important than medical costs as a factor increasing the amount of the food stamp benefit (Table 6). For example, housing costs affect the food stamp benefit for 75.6 percent of the single SSI recipients aged 18–64 and living alone; the medical cost deduction is relevant in only 4.3 percent of such cases. This outcome may reflect the fact that most SSI recipients are eligible for Medicaid. There are nuances: The excess housing cost deduction is important for an even higher percentage of persons living with a spouse than for singles living alone, and the prevalence of the medical cost deduction is lower for the elderly than for working-age recipients.
It is possible that the excess shelter cost deduction is important, but that this importance is not the product of special treatment of FSP households that include SSI recipients—in other words, the household's housing cost deduction does not exceed the maximum deduction ($378, in 2004) allowed for households without disabled or elderly persons. To investigate the importance of the excess housing cost deduction cap for these households, we counted the number of households where the deduction exceeds the cap. We include as having an excess shelter deduction all persons in Combined Application Project demonstrations, because they typically include a standardized housing cost deduction. As indicated by Table 7, in FY2004 the excess shelter deduction affects the food stamp benefit of almost 80 percent of households with SSI recipients. Seventeen percent of the SSI recipients affected by the excess housing cost deduction had an excess shelter cost that exceeded the cap applied to households without disabled or elderly members. For over 13 percent of all SSI/FSP recipients, the special treatment of SSI recipients in calculating the excess shelter cost deduction increased the monthly food stamp benefit by an average of $33 above what otherwise would have been received.
| Total | Under age 18 | Aged 18 to 64 | Over age 64 | |
|---|---|---|---|---|
| Estimated total SSI/FSP recipients a | 2,976,889 | 346,522 | 1,791,523 | 838,844 |
| Combined Application Project | 310,069 | 0 | 143,084 | 166,985 |
| With excess shelter deduction (including Combined Application Project participants) | 2,342,508 | 215,368 | 1,424,572 | 702,568 |
| Proportion of total receiving shelter deduction (percents) | 78.7 | 62.2 | 79.5 | 83.8 |
| Excess shelter deduction exceeds cap | 398,350 | 52,876 | 233,889 | 111,585 |
| Proportion living in households exceeding the shelter cap (percents) | 17.0 | 24.6 | 16.4 | 15.9 |
| Of those receiving the deduction of total | 13.4 | 15.3 | 13.1 | 13.3 |
| SOURCE: Authors' calculations using the Food Stamp Program Quality Control Database, 2004. | ||||
| NOTES: SSI = Supplemental Security Income; FSP = Food Stamp Program. | ||||
| a. Excludes California. | ||||
Again, we consider trends. Chart 2 shows the results of extending the calculation of the prevalence of effective excess housing cost deduction over time. For all groups, prevalence is greater in 2006 than in 2001, and in all cases the difference is statistically significant.
Prevalence of excess shelter cost deductions for SSI/FSP recipients, by age group, fiscal years 2001–2006
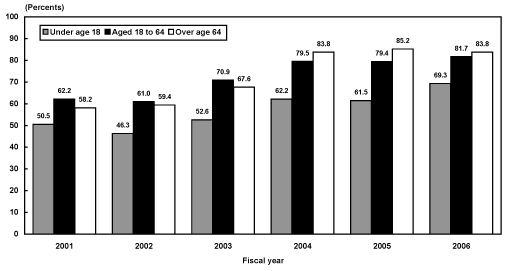
| Fiscal year | Under age 18 | Aged 18 to 64 | Over age 64 |
|---|---|---|---|
| 2001 | 50.52 | 62.21 | 58.16 |
| 2002 | 46.34 | 60.95 | 59.41 |
| 2003 | 52.64 | 70.86 | 67.60 |
| 2004 | 62.15 | 79.52 | 83.75 |
| 2005 | 61.48 | 79.40 | 85.17 |
| 2006 | 69.29 | 81.66 | 83.76 |
Improving Take-up
In sum, the Food Stamp Program quality control data indicate that the FSP provides benefits to at least half of all SSI recipients and that on average this contribution is a substantial increase in resources. This contribution is concentrated among recipients living in households that are wholly dependent on SSI or a combination of SSI and OASDI and are in consequence officially poor. It is natural to ask about the status of those SSI recipients who are not currently in households using food stamps. Is it possible that a significant number of these households might be eligible? In this section we show that the evidence is mixed, but there is evidence of potential for expanding take-up among currently nonparticipating households with SSI recipients.
Food Stamp Program Participation
Understanding the evidence of opportunity for increasing participation requires sufficient knowledge of how FSP participation is currently assessed.
While federally funded, the FSP is operated by states. The quality of state management varies; the FSPQC sample is in part conducted to monitor and reduce the variance in accuracy of benefit assessment, and the Farm Security and Rural Investment Act of 2002 established a "high performance bonus" to reward states for "actions taken to correct errors, reduce the rates of error, improve eligibility determinations, or other activities that demonstrate effective administration as determined by USDA" (Committee on Ways and Means 2004, 15–19; FNS 2002). In recent years, attention has also been paid to variation across states in FSP participation rates, the ratio of recipients to persons believed to be eligible. The Department of Agriculture estimates that nationwide only 60 percent of persons eligible for FSP in 2004 actually received benefits (Cunnyngham, Castner, and Schirm 2006, 3). The department has announced a target national participation rate of 68 percent in 2010 (FNS 2007). States varied enormously in estimated take-up rates in 2005, from a low of 40 percent in Wyoming to a high of 95 percent in Missouri (FNS 2007, 7).
The validity of estimates of FSP take-up is open to question, and this complicates their use as a measure of comparative state performance. The numerator of the ratio—persons in FSP recipient households—comes from Social Security administrative data and is reliable, at least in aggregate. Estimates of the denominator—the FSP eligible population—are more problematic. To estimate the number of individuals, the Food and Nutrition Service uses data on annual income for households from the Current Population Survey (CPS), which does not include information on all aspects of FSP eligibility requirements; some types of income are underreported, and the monthly pattern of income variation must be inferred from annual totals and other reported household characteristics, including joblessness and benefit receipt (Barrett and Poikolainen 2006, Appendix C). For some states the CPS samples are small, so estimates of the numbers of eligible households are constructed by combining state sample data with predictions based on data from other states (Cunnyngham, Castner, and Schirm 2007). Participation rate estimates are then reported with confidence intervals built around the assumptions that the imputation of eligibility is certain and uncertainty arises only from household sampling variability inherent in the CPS and FSPQC sample (Barrett and Poikolainen 2006, Appendix D). If there is error in the eligibility imputation itself, the reported confidence intervals exaggerate the reliability of the estimates both for assessing actual take-up among eligible households in any state and for comparing performance of one state with that of others.
The shortcomings of the FSP participation calculations are illustrated by recently published FNS estimates for SSI recipients (see Table 8). (The FNS is the division of the Department of Agricultural responsible for FSP operation.) If the estimates are accurate, by 2004 virtually every household with an SSI recipient that was FSP eligible in fact received benefits. In that case, promotion of FSP utilization among households with SSI recipients would not seem a promising opportunity for antipoverty strategy. However, SSI receipt is substantially underreported in the CPS, especially among children (Weinberg 2004; Nicholas and Wiseman 2007). FNS does not correct for SSI underreporting in its eligibility estimates, so there are presumably fewer SSI households than there should be in the denominator of the participation rates reported in the table. On the other hand, because of financial incentives created by the quality control program, it is likely that SSI is much more accurately reported in the FSPQC survey, the source of the numerator figures. Underreporting of the prevalence of SSI therefore exaggerates the degree of participation. The problem is even worse for TANF: The reported participation rate estimate for TANF was a logically impossible 125.8 percent in 2003 and 145.3 percent in 2004 (Barrett and Poikolainen 2006, 11). The participation report cautions that "Participation rates over 100 percent are due to reporting errors in the CPS," but fails to note acknowledged underreporting of SSI. Although not leading to participation rate figures as illogical as those reported for TANF, undoubtedly the report also exaggerates food stamp take-up within this group.
In unpublished work based on matching the 2003 CPS with Social Security administrative data, Nicholas and Wiseman (2007) estimate that the CPS undercounts SSI recipients for the entire year 2002 by one-third. If this applies as well to those households eligible for food stamps in each month, the participation rate among eligible households with SSI recipients is closer to 64 percent. This would seem to offer margin for improvement.
| SSI recipients | Eligible individuals (thousands) |
Participating individuals (thousands) |
Participation rate (percents) |
|||
|---|---|---|---|---|---|---|
| 2003 | 2004 | 2003 | 2004 | 2003 | 2004 | |
| Elderly | 1,264 | 1,288 | 1,167 | 1,250 | 92.3 | 97.0 |
| Nonelderly | 3,703 | 3,848 | 3,509 | 3,745 | 94.8 | 97.3 |
| Combined | 4,967 | 5,136 | 4,676 | 4,995 | 94.1 | 97.3 |
| SOURCE: Barrett and Poikolainen (2006). | ||||||
| NOTE: SSI = Supplemental Security Income. | ||||||
SSI Participation and State Food Stamp Program Management
There is indirect evidence that supports the hypothesis that the prevalence of FSP participation could be increased, at least in some states. Despite the technical issues raised above, there is general agreement that variation across states in estimated FSP participation does bear some relationship to state effectiveness in FSP promotion.6 If this is the case, it is interesting to see if interstate variation in food stamp receipt among households that include SSI recipients is related to variation in estimated aggregate state participation rates. If states with high aggregate participation rates also show exceptional participation by households that include SSI recipients, this would suggest that management makes a difference and that outreach procedures followed in high participation states should be studied and, if appropriate, imitated.
Note that if households with SSI recipients constituted a large fraction of all FSP eligible households, any connection between aggregate FSP take-up and prevalence among households with SSI recipients would be virtually tautological. However, the FNS estimate of the number of persons eligible for the FSP in an average month in 2004 is five times greater than the total number of SSI recipients (not all of whom are eligible), so it would be possible for variation in aggregate FSP take-up to occur independently of program participation among households that include SSI recipients.
Table 9 presents the results of regressing the ratio of the number of SSI recipients in FSP recipient households to total SSI caseload on the estimated state FSP participation rate. Recall from Table 2 that the nationwide FSP receipt rate for SSI recipients was about 50 percent. Our estimates by state for 2002 range from 31 percent to 78 percent. The regression estimate for 2002 shows that for each percentage increase in the state's estimated participant rate, the prevalence of food stamp receipt among SSI recipients increased by 7 percent. It is important to keep in mind what this does, and does not, mean. Not all SSI recipients are categorically eligible for the FSP, because some do not live alone or with only a recipient spouse. Because some SSI recipients live in households with substantial amounts of other income, we would not expect 100 percent prevalence of food stamp receipt even if every SSI eligible household took up the benefit. Nevertheless, the regressions indicate that SSI recipients in those states estimated to have high participation rates among all eligible persons are more likely themselves to be in FSP recipient households. The strength of the estimated relationship is surprising given that the independent variable, the participation rate, is probably measured with error and in consequence the estimated coefficient is biased downward.
| Fiscal year | Intercept | Food stamp participation rate coefficient |
R 2 |
|---|---|---|---|
| 2002 | 0.0897 (0.0848) |
0.7115 (0.1512) |
0.32 |
| 2003 | 0.0838 (0.0775) |
0.5222 (0.1319) |
0.25 |
| 2004 | 0.2935 (0.0768) |
0.4344 (0.1431) |
0.16 |
| SOURCE: Authors' calculations. | |||
| NOTES: SSI = Supplemental Security Income; FSP = Food Stamp Program. | |||
| a. Percent of state SSI recipients living in households receiving food stamp benefits. | |||
Food and Nutrition Service researchers estimate that over the 2002–2004 period, the aggregate national FSP participation rate increased from 54 percent to 56 percent to 60 percent, respectively (Cunnyngham and others 2006, 5). Comparison of the regression results in Table 9 across these three years indicates that while in each year interstate variation in receipt of FSP benefits by SSI recipients is correlated with variation in participation rates, both the slope and correlation diminish. Whatever it is about a state that is measured by the estimated aggregate participation rate, the connection with interstate variation in food stamp receipt by SSI recipients is weakening.
We conclude that FSP participation by households with SSI recipients is lower than some estimates suggest and that attention should be paid to obtaining better estimates of potential gains from renewed FSP outreach among SSI recipients, especially those who live with others.
Conclusion and Future Research
The Congressional Research Service counts 84 federal mean-tested social assistance programs (Spar 2006). Such multiplicity serves many ends, both substantive and political, and in many instances efforts at coordination would probably not have benefits commensurate with the costs of developing the agency linkages required. This article has shown that the overlap between the FSP and SSI is significant and that the FSP benefit contributes substantially to the resources of the households of about half of all SSI recipients. We argue that measures of FSP take-up by eligible households that include SSI recipients overstate participation and, as a result, may be misleading as a basis for predicting the payoff to renewed agency efforts to raise FSP participation.
There are at least three promising future steps: First, we need better estimates of FSP participation, both generally and among households that include SSI recipients. In cooperation with the Census Bureau, the Social Security Administration regularly merges data from the Annual Social and Economic Supplement (ASEC), known as the March Supplement, to the Current Population Survey (CPS) with its own administrative data on earnings, OASDI, and SSI receipt (see Nicholas and Wiseman (2007) for an example of use of these data). Merging is performed under secure conditions using a special "cross-walk" file that includes Social Security numbers. The FSPQC sample data do not include Social Security numbers, but FNS collects such information for its FSP recipients. The addition of FSP administrative data on food stamp receipt to the merged CPS/ASEC file, carried out under a security protocol comparable with that used for SSA data, would support better estimation of participation and better identification of households that are eligible for food stamps but do not receive the benefits. From the FNS perspective, the results could be used to assess the validity of participation rates estimated using unadjusted CPS data (as is current practice). For SSA, the results might provide greater insight concerning the characteristics of SSI recipient households that are eligible for food stamps but not participating in the program and the gains from greater outreach effort. Haider, Jacknowitz, and Schoeni (2003) argue that while Food Stamp Program take-up among apparently eligible elderly families is lower than for other groups, so too is the need for food assistance. Are the characteristics of nonparticipating SSI recipients consistent with this conclusion?
Second, the effort to merge FNS and SSA data to assess the potential gain from outreach should be complemented with a more direct approach to assessing FSP participation among households with SSI recipients—a survey. Our estimates indicate that 46 percent of all SSI recipients live in households that do not receive FSP benefits. Thus about half of persons interviewed in a well-designed random survey of SSI recipients should be found to reside in households not receiving food stamp assistance. The survey could investigate eligibility. The results would provide direct evidence on the likely gains from expanded systematic FSP promotion among SSI recipients and possibly create a profile of eligible nonrecipients that could focus outreach efforts.
Third, consideration should be given to conducting a joint review of the FNS/SSA Combined (food stamp) Application Project (CAP). CAP is described as "A Government Partnership to Increase Food Stamp Program Participation among the Elderly and Disabled" (FNS 2005). At present most outreach efforts are focused on single SSI recipients living independently. However, attention should be given to (1) expanding the project to include couples and (2) finding ways of informing households in which SSI recipients live with others of the benefits of FSP participation. Recently a number of states have developed innovative ways to stimulate participation, but these efforts have been carried out largely without SSA involvement. The time may have come for a review and renewal of the interagency partnership. A comprehensive and collaborative review of the CAP record would seem a place to start and a useful complement to what is learned from a data merge experiment and a recipient survey.
Notes
1. TANF is the nation's income of last resort program for needy families with children. The Section 8 Housing Assistance program provides means-tested rent subsidies to low-income families and individuals. For details, see Committee on Ways and Means (2004), sections 7 and 15.
2. Unless otherwise noted, throughout this article the term "states" includes the District of Columbia.
3. This amount is adjusted annually; different caps apply in Alaska and Hawaii.
4. This count comes from unpublished tabulations provided by the Office of Evaluation, Food and Consumer Service, U.S. Department of Agriculture.
5. To support this statement, we constructed a measure of state housing costs in 2004 using the area data in the Economic Policy Institute's Basic Family Budgets series (Economic Policy Institute 2005). The simple correlation between the housing cost index and presence of a state supplement was .35. Details on this and an analysis of the prevalence of food stamp receipt by state supplement size are available from the authors of this article.
6. As a result, FNS bases part of the Food Stamp High Performance Bonus on participation achievement, which is taken to reflect "exceptional customer service" and "exceptional administration of the Food Stamp Program." See "USDA Awards $18 Million to States for Exceptional Customer Service in Food Stamp Program" (Press release No 0255.07, September 20, 2007, http://www.fns.usda.gov/cga/PressReleases/2007/PR-0255.htm.
References
Arnold, Autumn, and Amy Marinacci. 2003. Cash-out in California: A history of help and harm. San Francisco: California Food Policy Advocates. http://www.cfpa.net/CashoutinCA2003.pdf.
Barrett, Allison, and Anni Poikolainen. 2006. Food Stamp Program participation rates: 2004. In Current perspectives on Food Stamp Program participation. Washington, DC: U.S. Department of Agriculture. http://www.fns.usda.gov
Committee on Ways and Means. 2004. 2004 Green book: Background material and data on the programs within the jurisdiction of the Committee on Ways and Means. Washington, DC: U.S. Government Printing Office.
Cunnyngham, Karen E., Laura A. Castner, and Allen L. Schirm. 2006. Reaching those in need: State Food Stamp participation rates in 2004. Washington, DC: Food and Nutrition Service, U.S. Department of Agriculture.
———. 2007. Empirical bayes shrinkage estimates of state Food Stamp participation rates in 2002–2004 for all eligible people and the working poor. Washington, DC: Mathematica Policy Research (April).
DeNavas-Walt, Carmen, Bernadette D. Proctor, and Cheryl Hill Lee. 2005. Income, poverty, and health insurance coverage in the United States: 2004. Current Population Reports, P60-229. Washington, DC: U.S. Government Printing Office.
Economic Policy Institute. 2005. Basic family budget spreadsheets. http://www.epi.org/content.cfm/datazone_fambud_xls_index.
[FNS] Food and Nutrition Service. 2002. 2002 Farm Bill: Section-by-section summary of provisions affecting Food Stamp provisions. Washington, DC: U.S. Department of Agriculture. http://www.fns.usda.gov/cga/2002_Farm_Bill/food_stamps.html.
———. 2005. Combined application projects: Guidance for states developing projects. Washington, DC: U.S. Department of Agriculture. http://www.fns.usda.gov/fsp/government/promising-practices/CAPsDevelopmentGuidance.pdf.
———. 2007. Reaching those in need: State Food Stamp participation rates in 2005. Washington, DC: U.S. Department of Agriculture.
Haider, Steven J., Alison Jacknowitz, and Robert F. Shoeni. 2003. Food Stamps and the elderly: Why is participation so low? Journal of Human Resources 38 (Supplement): 1080–1111.
Nicholas, Joyce, and Michael Wiseman. 2007. Elderly poverty and Supplemental Security Income. Paper prepared for the 29th Annual Research Conference, Association for Public Policy and Management, Washington, DC (November 8–10).
Poikolainen, Anni, and Daisy Ewell. 2005. Technical documentation for the fiscal year 2004: FSPQC Database and QC Minimodel. Washington, DC: Mathematica Policy Research, Inc.
[SSA] Social Security Administration. 2005a. State assistance programs for SSI recipients, January 2004. Baltimore, Maryland:, Office of Policy, Office of Research, Evaluation, and Statistics.
———.2005b. SSI annual statistical report, 2004. Baltimore, Maryland: Office of Policy, Office of Research, Evaluation, and Statistics.
Spar, Karen. 2006. Cash and noncash benefits for persons with limited income: Eligibility rules, recipient and expenditure data, FY2002–2004. Report No. RL33340. Washington, DC: Congressional Research Service.
Wamhoff, Steve, and Michael Wiseman. 2007. The TANF/SSI connection. Social Security Bulletin 66(4): 21–36.
Weinberg, Daniel H. 2004. Income data quality issues in the Annual Social and Economic Supplement to the Current Population Survey. Paper prepared for the University of Maryland-American Enterprise Seminar on Reconsidering the Federal Poverty Measure. http://www.census.gov/hhes/www/income/cpsdataquality101504.pdf.